[KT Cloud TechUp] expoid_db 데이터 시각화 대시보드 제작
October 21, 2025
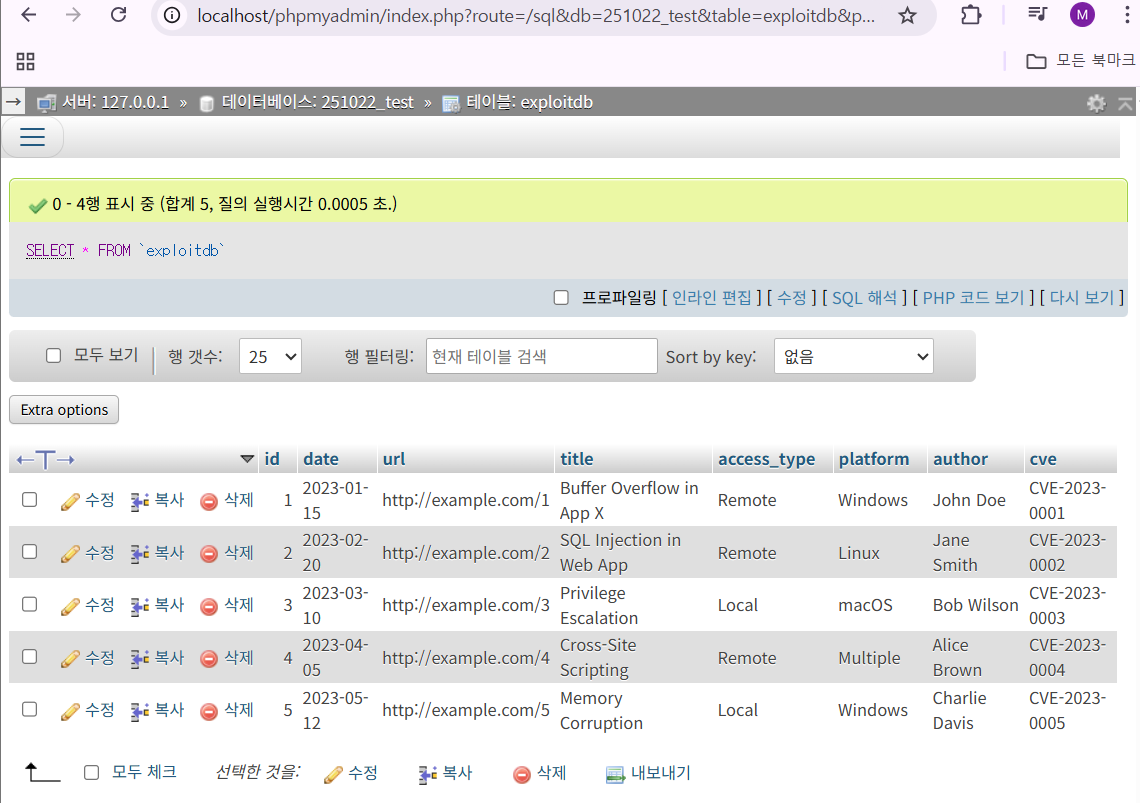 우선은 phpmyadmin에서 테이블을 제작하고 간단한 테스트 데이터들을 넣어두었다.
[php란?]
- 오픈소스 언어로 데이터베이스와 연동이 간편한 언어이다.
<?php
echo "Hello, World!";
$name = "홍길동";
echo "안녕하세요," . $name . "님!";
//html과 결합 ?>
의 페이지
```
- 주요 용도: 웹 개발 (동적 웹페이지 생성), CMS (WordPress, Drupal 등), 웹 애플리케이션 (쇼핑몰, 게시판 등), API 개발 (RESTful API 구축)
<?php
// visualize_exploits.php
// Usage: configure MySQL credentials below and place this file on a PHP-enabled webserver.
// Expected MySQL table structure (example):
// CREATE TABLE exploits (
// id INT AUTO_INCREMENT PRIMARY KEY,
// date VARCHAR(50),
// url TEXT,
// title TEXT,
// access_type VARCHAR(100),
// platform VARCHAR(100),
// author VARCHAR(100),
// cve VARCHAR(100)
// );
// ---------- Configuration: edit these ----------
$dbHost = '127.0.0.1';
$dbName = 'mysql_251021';
$dbUser = 'root';
$dbPass = '';
$dbTable = 'exploitdb'; // table name
$perPage = 100; // rows per page for pagination
// -----------------------------------------------
// PDO connection
$dsn = "mysql:host={$dbHost};dbname={$dbName};charset=utf8mb4";
try {
$pdo = new PDO($dsn, $dbUser, $dbPass, [
PDO::ATTR_ERRMODE => PDO::ERRMODE_EXCEPTION,
PDO::ATTR_DEFAULT_FETCH_MODE => PDO::FETCH_ASSOC,
]);
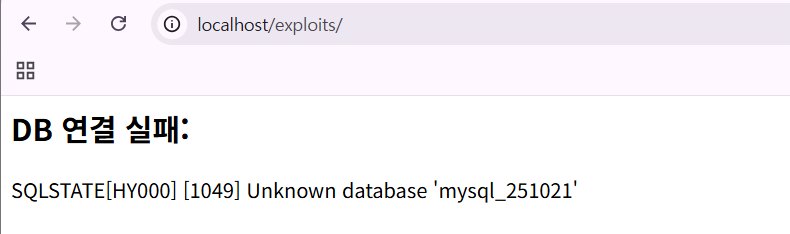
} catch (Exception $e) {
echo "<h2>DB 연결 실패:</h2>" . htmlspecialchars($e->getMessage());
exit;
}
// paging
$page = isset($_GET['page']) ? max(1, (int)$_GET['page']) : 1;
$offset = ($page - 1) * $perPage;
// basic search filter
$q = isset($_GET['q']) ? trim($_GET['q']) : '';
$params = [];
$where = '';
if ($q !== '') {
// search in title, author, cve, platform
$where = "WHERE title LIKE :q OR author LIKE :q OR cve LIKE :q OR platform LIKE :q";
$params[':q'] = "%{$q}%";
}
// count total
$countSql = "SELECT COUNT(*) AS cnt FROM `{$dbTable}` {$where}";
$stmt = $pdo->prepare($countSql);
$stmt->execute($params);
$total = (int)$stmt->fetchColumn();
$totalPages = max(1, (int)ceil($total / $perPage));
// fetch rows
$sql = "SELECT date, url, title, access_type, platform, author, cve
FROM `{$dbTable}` {$where}
ORDER BY date DESC
LIMIT :limit OFFSET :offset";
$stmt = $pdo->prepare($sql);
foreach ($params as $k => $v) $stmt->bindValue($k, $v, PDO::PARAM_STR);
$stmt->bindValue(':limit', (int)$perPage, PDO::PARAM_INT);
$stmt->bindValue(':offset', (int)$offset, PDO::PARAM_INT);
$stmt->execute();
$rows = $stmt->fetchAll();
// aggregates for charts
$byPlatform = [];
$byAuthor = [];
$byYear = [];
foreach ($rows as $r) {
$p = $r['platform'] ?: 'Unknown';
$byPlatform[$p] = ($byPlatform[$p] ?? 0) + 1;
$a = $r['author'] ?: 'Unknown';
$byAuthor[$a] = ($byAuthor[$a] ?? 0) + 1;
$year = 'Unknown';
if (preg_match('/(\d{4})/', $r['date'], $m)) {
$year = $m[1];
} else {
$ts = strtotime($r['date']);
if ($ts) $year = date('Y', $ts);
}
$byYear[$year] = ($byYear[$year] ?? 0) + 1;
}
arsort($byPlatform);
arsort($byAuthor);
ksort($byYear);
function h($s) { return htmlspecialchars($s, ENT_QUOTES | ENT_SUBSTITUTE, 'UTF-8'); }
?>
<!doctype html>
<html lang="ko">
<head>
<meta charset="utf-8">
<meta name="viewport" content="width=device-width,initial-scale=1">
<title>Exploit DB 시각화 (MySQL)</title>
<style>
body{font-family:Inter,system-ui, -apple-system, 'Segoe UI', Roboto, 'Helvetica Neue', Arial; padding:20px;}
table{border-collapse:collapse;width:100%;}
th,td{border:1px solid #ddd;padding:8px;text-align:left;font-size:13px}
th{background:#f3f4f6}
.grid{display:grid;grid-template-columns:1fr 420px;gap:20px}
.card{background:#fff;border:1px solid #e5e7eb;padding:12px;border-radius:8px}
.controls{margin-bottom:12px}
input[type=search]{padding:8px;width:100%;box-sizing:border-box}
.small{font-size:12px;color:#6b7280}
.pager{margin-top:8px}
.pager a{margin-right:6px;text-decoration:none}
@media(max-width:900px){.grid{grid-template-columns:1fr}}
</style>
<script src="https://cdn.jsdelivr.net/npm/chart.js"></script>
</head>
<body>
<h1>Exploit 데이터 (MySQL) 시각화</h1>
<p class="small">전체 레코드: <strong><?php echo $total; ?></strong></p>
<form method="get" class="controls" style="max-width:600px">
<input type="search" name="q" placeholder="검색 (제목/저자/CVE/플랫폼)" value="<?php echo h($q); ?>">
<button type="submit">검색</button>
</form>
<div class="grid">
<div>
<div class="card" id="tableCard">
<table id="dataTable">
<thead>
<tr>
<th>날짜</th>
<th>제목</th>
<th>접근</th>
<th>플랫폼</th>
<th>저자</th>
<th>CVE</th>
</tr>
</thead>
<tbody>
<?php foreach ($rows as $r): ?>
<tr data-url="<?php echo h($r['url']); ?>">
<td><?php echo h($r['date']); ?></td>
<td><?php echo h($r['title']); ?></td>
<td><?php echo h($r['access_type']); ?></td>
<td><?php echo h($r['platform']); ?></td>
<td><?php echo h($r['author']); ?></td>
<td><?php echo h($r['cve']); ?></td>
</tr>
<?php endforeach; ?>
</tbody>
</table>
<div class="pager">
<?php if ($page > 1): ?>
<a href="?<?php echo http_build_query(array_merge($_GET, ['page' => $page - 1])); ?>">« 이전</a>
<?php endif; ?>
<span>페이지 <?php echo $page; ?> / <?php echo $totalPages; ?></span>
<?php if ($page < $totalPages): ?>
<a href="?<?php echo http_build_query(array_merge($_GET, ['page' => $page + 1])); ?>">다음 »</a>
<?php endif; ?>
</div>
</div>
</div>
<div>
<div class="card">
<h3>플랫폼 분포</h3>
<canvas id="platformChart" width="400" height="300"></canvas>
</div>
<div class="card" style="margin-top:12px">
<h3>저자 상위</h3>
<canvas id="authorChart" width="400" height="300"></canvas>
</div>
<div class="card" style="margin-top:12px">
<h3>연도별 발생 수</h3>
<canvas id="yearChart" width="400" height="200"></canvas>
</div>
</div>
</div>
<script>
const byPlatform = <?php echo json_encode(array_values($byPlatform)); ?>;
const byPlatformLabels = <?php echo json_encode(array_keys($byPlatform)); ?>;
const byAuthor = <?php echo json_encode(array_values(array_slice($byAuthor,0,10))); ?>;
const byAuthorLabels = <?php echo json_encode(array_keys(array_slice($byAuthor,0,10))); ?>;
const byYearLabels = <?php echo json_encode(array_keys($byYear)); ?>;
const byYear = <?php echo json_encode(array_values($byYear)); ?>;
new Chart(document.getElementById('platformChart'), {
type: 'pie',
data: { labels: byPlatformLabels, datasets: [{ data: byPlatform }] },
options: {responsive:true}
});
new Chart(document.getElementById('authorChart'), {
type: 'bar',
data: { labels: byAuthorLabels, datasets: [{label:'발생 수', data: byAuthor}] },
options: {responsive:true, scales:{y:{beginAtZero:true}}}
});
new Chart(document.getElementById('yearChart'), {
type: 'line',
data: { labels: byYearLabels, datasets: [{label:'건수', data: byYear, fill:false, tension:0.2}] },
options: {responsive:true, scales:{y:{beginAtZero:true}}}
});
document.querySelectorAll('#dataTable tbody tr').forEach(tr => {
tr.addEventListener('click', () => {
const url = tr.dataset.url;
if (url) window.open(url, '_blank');
});
});
</script>
<footer style="margin-top:18px;font-size:12px;color:#6b7280">
MySQL에서 직접 데이터를 읽어 표와 차트를 생성합니다. DB 칼럼이나 테이블 이름이 다르면 상단 설정을 수정해주세요.
</footer>
</body>
</html>뼈대 코드는 위와 같다.
 접속까지 완료했다.
db 연결을 해주자
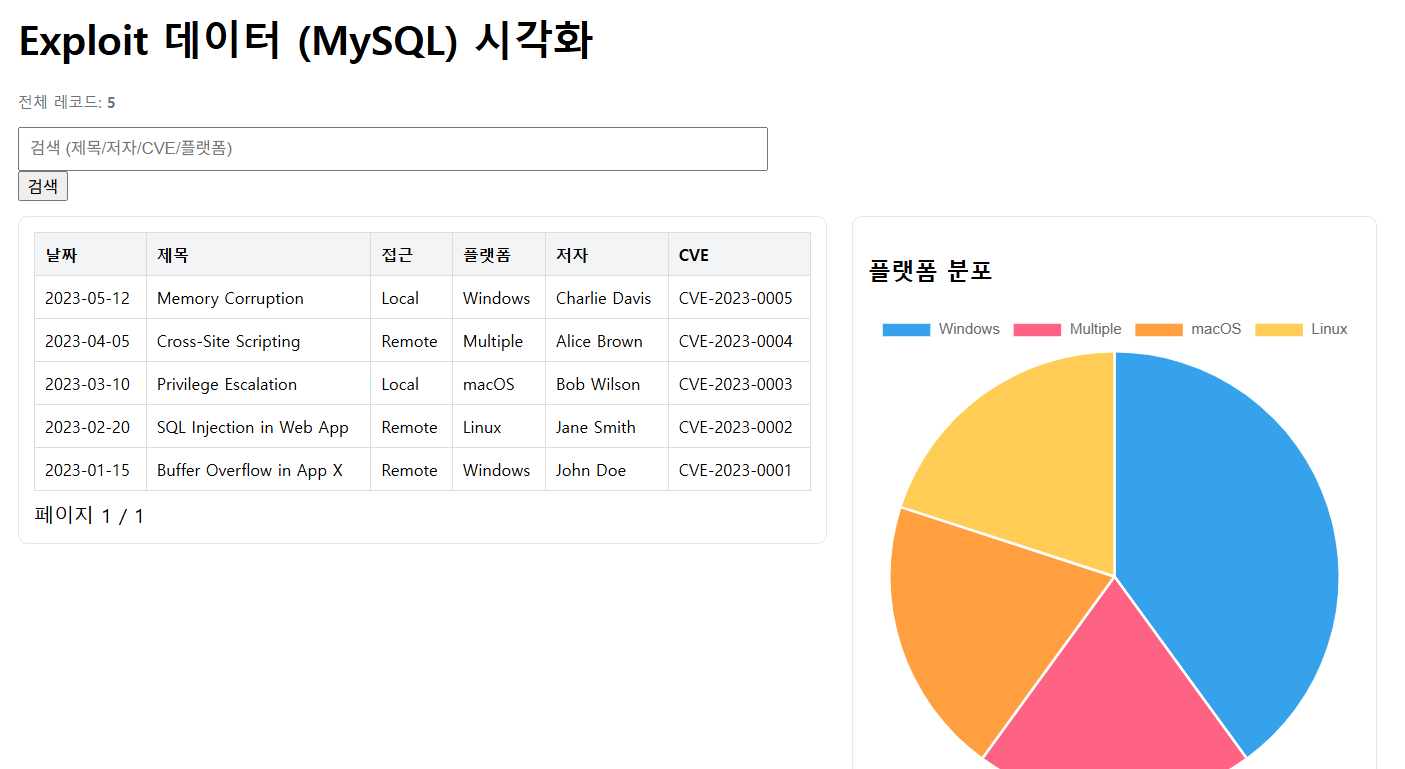
짠~
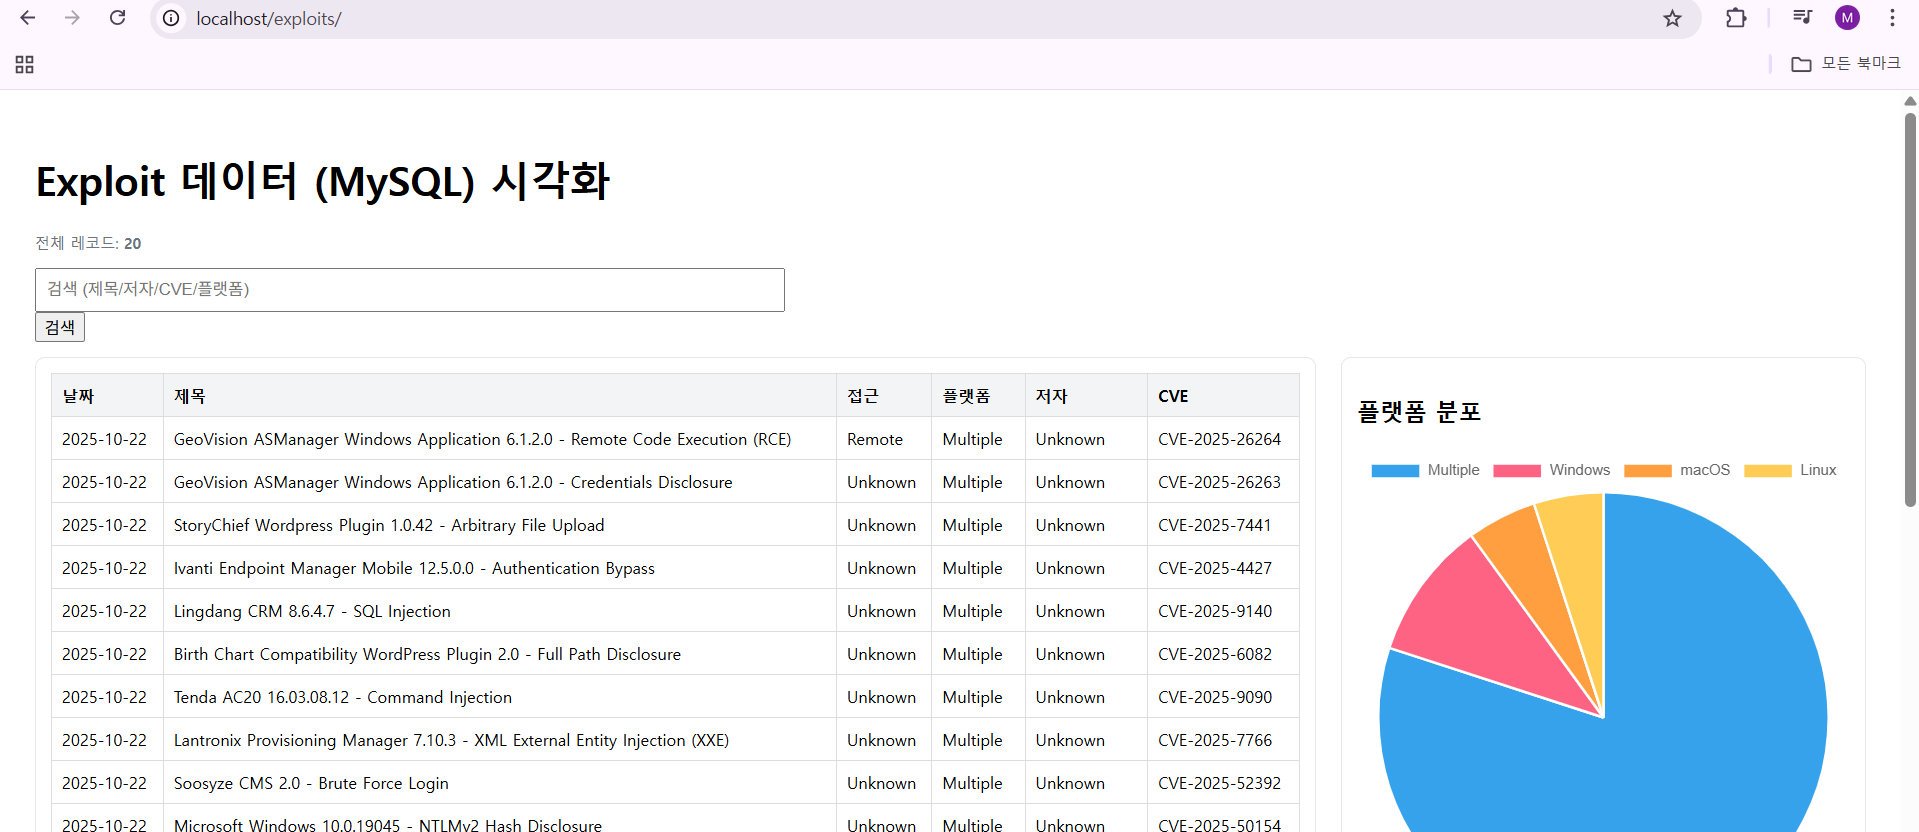 어제 만든 크롤링 코드와 연동까지 완료했다.
exploid-db 사이트에 있는 취약점을 긁어와서 시각화까지 해주는 대시보드 제작 완료.
어제 만든 크롤링 코드와 연동까지 완료했다.
exploid-db 사이트에 있는 취약점을 긁어와서 시각화까지 해주는 대시보드 제작 완료.